
What is the Keltner Channel?
The Keltner Channel is an indicator specifically designed for technical analysis and changes in the market to analyze profits and losses. It is used by traders in multiple markets to predict scenarios of possible profits and losses. The Keltner Channel application was introduced by Chester W. Keltner in 1960.
Design
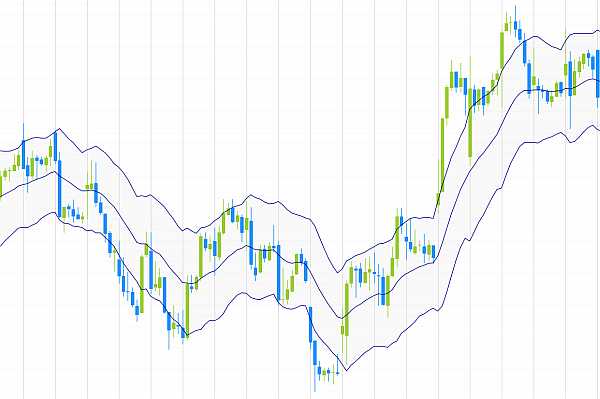
It has been specifically designed to take into account the average true range calculations with both high and low costs which may occur over a 10 day period of trading. Thereby the application represents volatility of the movement of stocks by averaging the high, low and closing costs. These three movements are represented as the center line and the two other lines or bands. These are referred to as the “envelope”. The Keltner Channel Signals are shown when there is a break either above or below the middle channel bands.
Analyzing Oversold and Overbought Stocks
The Keltner channel shows an over bought stock in the market when the market cost is close to the upper band. Similarly, when the stocks are over sold the band is closer to the lower band. Using this understanding a trader can observe the cost trends of their stocks in the market. When the market cost and cost close is near the upper band, the trader uses it as a signal to buy. Similarly when the market cost and cost close is near the lower band, a trader takes it as a signal to sell their stocks.
Calculations
The middle channel band is formed by deriving the exponential moving average of the High Cost, Low Cost and Close Cost. The value obtained is referred to as the Average True Range (ATR). A continued channel is preferable when analyzing the progress of the stock. The most common settings used for moving average is 20 bars and for ATR it is 10 bars. It is also a common practice to multiply the ATR which is usually 1.5, before adding and subtracting its value from the moving average.
Therefore, to work out the center-line moving average, you use the moving average which is typically 10 periods. Then multiply the moving average cost by the ATR (1.5) to plot the upper bands and lower bands.
Advantages
Although the Keltner Channel is not as popular as the Bollinger Bands or the Commodity Channel Index (CCI), it has its own advantages as an analysis tool. Compared to other analysis tools, the Keltner Channel indicator is more sensitive to fluctuations and volatility because the markets lag is not as pronounced in the Keltner Channel. The fluctuations are very sensitive and are very helpful in knowing when to buy and sell products, stocks or shares immediately there is a change in the market.
How It Helps You Become a More Successful Trader
When the market cost is close to the lower lines it is a signal that the market is going to fall, while if the market cost is close to the upper band line, this is a signal of rises. Based on this strategy one should buy and sell according to the trend. It is important to mention that the Keltner indicator should be used for a confirmation of profitable opportunities. There is other analysis you should always do rather than placing a trade solely based upon the Keltner channel. The candlestick chart is an application which works well.