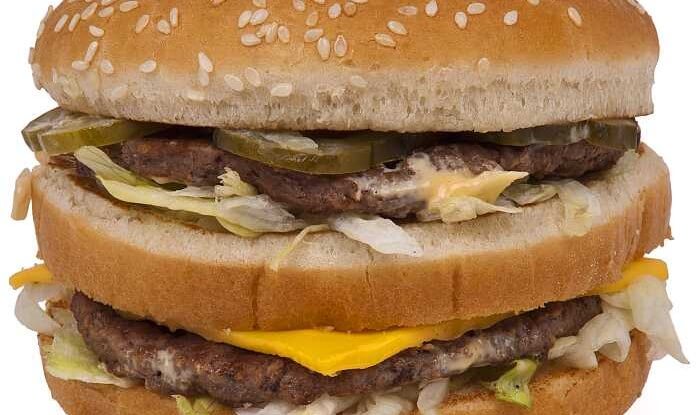
If you travel to any part of the world, you’re likely to find a pair of ominous golden arches beckoning you to one of the world’s largest fast food chains. This is because McDonald’s has over 32,000 outlets in 119 countries. You might even buy yourself a meal that features the iconic Big Mac: a three part sesame seed bun stuffed with two beef patties, cheese, lettuce, pickles, onions and the special “Mac” sauce. The price of this signature burger is often compared around the globe and used to determine the value of international currencies.
This “Big Mac Index” was first introduced by Pam Woodall in an issue of The Economist, published in September 1986. Today it’s still widely considered an informal measure of purchasing power parity between two currencies by comparing the cost of the Big Mac in any two countries.
How it’s Calculated
 The Big Mac Index is based on Purchasing Power Parity (PPP) theory, which states that the same basket of goods and services in different countries should cost about the same if exchange rates are working properly. The method is fairly simple: The Economist divides the price of a Big Mac in two countries and compares the resulting figure to the currencies’ published exchange rates.
For example, in 2011 the price of a Big Mac in Britain, in dollars, was $3.89. This was compared to the actual exchange rate and the implied PPP of the dollar was $1.70. A lower value than the actual exchange rate indicates that the first currency has been undervalued, while a higher value indicates the opposite. Since the actual exchange rate was $1.63, the pound is undervalued by 4% against the dollar.
Criticisms of the Index
The most common criticism of the index is that the formula doesn’t take into account factors such as production and delivery costs, regional taxes, trade barriers on beef, local competition, demand and the cost of non-trade inputs such as rent and workers’ wages. Big Macs vary in weight and calorie content from country to country and In India, the Maharaja Mac is made of chicken, because many Indians are Hindu and thus do not eat beef.
Despite these shortcomings, the Big Mac Index is published annually, as its PPP estimates are not very different to those calculated by more sophisticated models, and studies have found that the Big Mac PPP is a good predictor of future movements. Besides that, the index is widely considered a light-hearted and fun way of checking whether currencies are at their “correct” value against the dollar.
Lattenomics and Other Alternative Indices
Three similar indices have been developed in the past decade. In 2004, the Tall Latte Index featured a Starbucks coffee. Three years later, it was the iPod Index and in 2009, IKEA came up with a Bloomberg Billy Index, which compared the global prices of a bookshelf. Although these indices are also fundamentally flawed measures of PPP, for much the same reasons as the Big Mac Index, they’re nevertheless a fun way to understand exchange rates.
Suggested Additional Reading:
“Essays in Economic History: Purchasing Power Parity, Standard of Living, and Monetary Standards” – by Lawrence H. Officer
This book is the culmination of and a collection of distinguished scholar Lawrence Officer’s principal research over 50 years of scholarly activity. The collection consists primarily of three topics on which the author has spent the major part of his research: purchasing power parity, standard of living, and monetary standards. There is also a unique chapter on economics and economic history in science fiction. This volume is ideal for academics, graduate and undergraduate students, and practitioners.


