You’ve probably heard some of the following sayings and terms from the financial press…”Sell in May and Go Away”, “The Santa Claus Rally”, “The January Effect”, etc. The question is, does the stock market have seasonal patterns that an investor can use to enhance their returns? The answer is yes, but…
There is, in fact, a seasonal bias to the stock market, and by paying attention to these market tendencies your portfolio can gain a slight edge over the long haul. However, these macro trends don’t always hold true, and won’t save you when you’re wrong on a micro trend. In other words, there may be an historical upward bias in the stock market between Christmas and New Years Day (i.e. The Santa Claus Rally) but if you’re making bad choices on which sectors, industries, or individual stocks to buy, you will still end up with losses in your account…and coal in your stocking.
There are many identifiable seasonal patterns in the market. Below is a description of the most popular ones, along with our opinions on why the pattern exists and how to use it to your advantage:
Sell in May and Go Away
This saying is an old British adage based on the idea that the period from November to April has stronger historical market growth on average than May through October. Statistically, this is correct.
Looking at the performance of the S & P 500 dating back to 1926, a trader who each year sold the index stocks in May and bought back in October would have created an average annual return of 8.4% over the last 86 years. By contrast, those who followed the opposite strategy of buying in May and selling in October would have generated a return of only 5.1%. Both calculations include dividends and interest on the cash that would be seasonably generated, but not transaction costs or taxes.
So the adage is true, but… If you had not sold in May and held your stocks year round, you would have generated a return of 10.0% over the same time period, while minimizing both tax consequences and transaction costs.
Santa Claus Rally
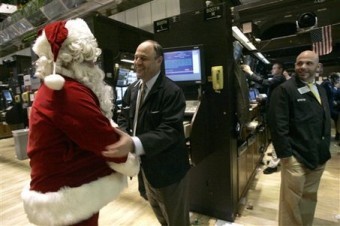
As mentioned earlier, it’s the historical rise in stock prices in the last week of the calendar year. The Santa Claus rally is really created by the next two patterns we’re going to cover. It is a combination of traders buying in anticipation of the January Effect, and fund managers buying stocks prior to the end of the year for Window Dressing.
There can be some short term profits to be made here if you buy in ahead of the rally. Plus, when you take profits, you get another year to pay the taxes because you sold after January 1st. Since these gains will be short-term, that does make a nice little tax deferral.
January Effect
This phenomenon is that small cap stocks outperform mid and large size companies during the month of January. The rationale behind the January Effect is that institutional and individual traders who are tax sensitive tend to sell late in the year in order to take losses on riskier stocks.
IRS rules dictate that you must wait 30 days to buy the same stock back, or you will have a wash sale and your tax loss will be disallowed. So, 30 days after selling in December for taxes, there is more buying in small companies in January.
In recent years, the January Effect has been quite muted and there are few, if any, arbitrage opportunities for investors who want to take advantage of the effect.
Window Dressing
This is the idea that stocks on an upward swing will get stronger at the end of the calendar quarter because mutual fund managers sell under-performing stocks from their portfolios and use the proceeds to buy good performing stocks that will make their funds appear more successful. It’s done as a marketing ploy.
There can be some short term profits to be made by picking the correct high flying stocks, but… it takes very little time for those profits to disappear if you hold too long.
Earnings Season
Earnings season comprises most of the month following the end of each calendar quarter. Companies will start announcing earnings as early as the second week of the month and within a few weeks, the vast majority of publicly traded companies will have announced.
If you watch the larger, bell weather stocks early in the earnings season, often times you can pick up on a trend of strong or weak earnings. While each individual company has the opportunity to buck the trend, more often than not, the majority will fall into either the camp of positive or negative results, and the market direction will follow the majority. These trends can be strong at times, but… every now and then, will reverse themselves mid-season.
Triple Witching
Triple Witching occurs on the third Friday of every March, June, September, and December. This is the day when stock options, index futures, and index options all expire on the same day. This day typically has high trading volume with high levels of volatility, particularly in the last hour before the stock market closes, which is known as, “The Witching Hour”.
Some day traders look at the increased volume and volatility as opportunities to make quick gains, which is true, but… There are also opportunities for quick losses and getting whipsawed. Our recommendation is to stay out of it. We look at Triple Witching day as a great day to get out of the office and spend time doing something you enjoy.
In summary, yes, the stock market does have seasonal patterns that can be identified through historical data. However, it’s important to note that these are not etched in stone, and will have varied levels of strengths and weaknesses depending upon other prevailing market conditions. Therefore, seasonality patterns should not be used as a primary trading consideration, nor for that matter, even a secondary consideration. It is just something to keep in the back of your mind when determining entry and exit points.
If you trade index ETFs, options, or futures, you should probably pay more attention to the seasonality of the markets than somebody who trades a more concentrated portfolio of individual stocks, but… frankly, not that much.
*If you’d like to learn more about the subject of stock market seasonality patterns, we recommend reading the book, “Seasonal Stock Market Trends: The Definitive Guide to Calendar-Based Stock Market Trading”, by Jay Kaeppel. It’s available on Amazon in either a hardcover or Kindle version. Click here to read reviews or buy yourself a copy today.


